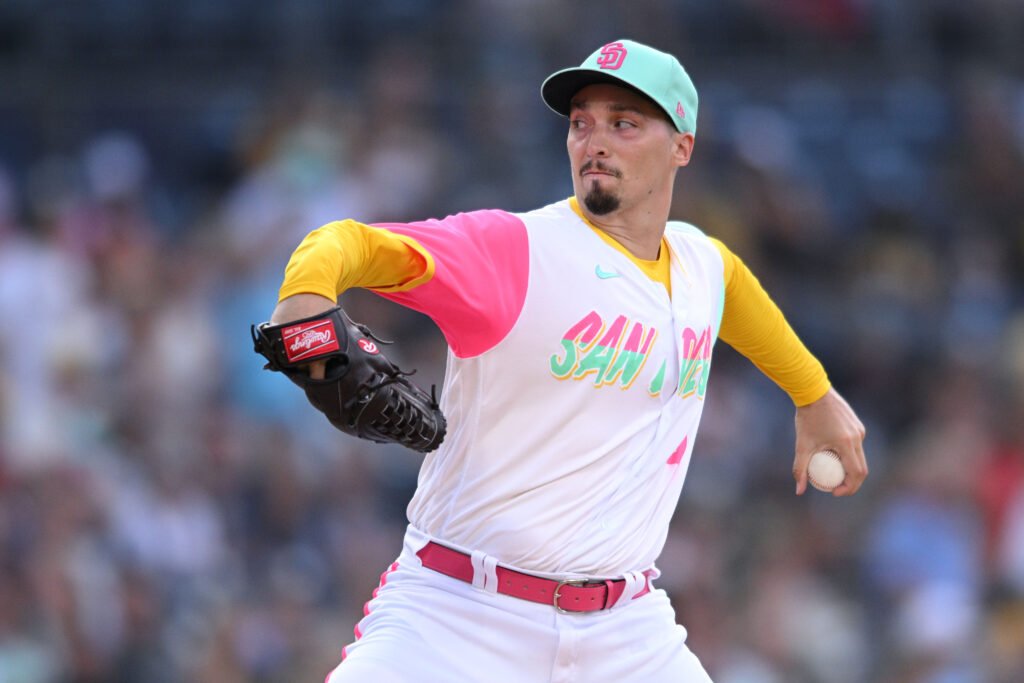
Padres need a huge season out of Blake Snell
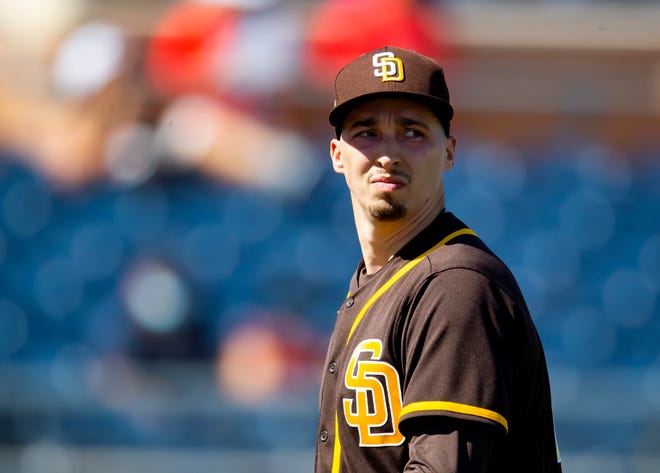
Mandatory Credit: Orlando Ramirez-USA TODAY Sports
It’s a big year for the San Diego Padres and Blake Snell in 2023.
The lefty is a free agent after next season, one who needs to show exactly what he’s capable of. In 2018, the southpaw showed exactly that. 180.2 innings, 1.89 ERA, Cy Young, ERA title, 217 ERA + (117% better than the average AL pitcher that year).
From 2019 onwards, Snell hasn’t thrown more than 130 innings in a season, he’s posted ERAs north of 4.00 twice, and he’s yet to have a season with an ERA south of 3.00 since. He hasn’t been bad, but after being the best pitcher in the AL in 2018, he’s not been back to an All-Star game.
So, what’s gone wrong for Snell?
Walk it off
Control has always been an issue for Snell, who’s walked more than 10% of the batters he’s faced in his career. He’s a strikeout artist, as he’s struck out more than 30% of opponents in each of his last five campaigns. However, sometimes his paint gets sloppy, which leads to control issues. His lack of control reached its peak in 2021 when Snell walked an astronomical 12.6% of batters. Walking batters is obviously bad, as it leads to baserunners and extends innings, but it also shortens Snell’s length. He’s only thrown more than 130 innings once, and while a big part of that is his struggles to stay healthy, another is his short outings. In 2022, Snell worked more than six innings only once, while falling short of six innings in 54% of his starts. That lack of volume has always capped the left-hander’s productivity.
Exit Vel-oh no!
In 2018, Snell allowed an average exit velocity of 87.7 miles per hour, with opponents recording a hard hit (exit velocity of 95 MPH+) 35% of the time. In Snell’s time in San Diego, his hard hit % sits north of 40. His exit velocity is a mile per hour higher, finding itself at 88.8 miles per hour. The jump in exit velocity is the major reason why Snell’s slugging percentage has jumped 75 points since 2018. He’s seen his home run rate jump from 2.3% up to 3.0%. All of that is why Snell, who posted a career-best .242 BABIP (batting average on balls in play) in 2018, is yet to have a season better than .288 since. The quality of the contact is a major issue for Snell. Due to his high strikeout rate, he doesn’t get often, but he does get hit hard more than most.
A tale of two seasons:
2018 Blake Snell: 2.94 FIP, 11.0 K/9, 3.2 BB/9, 0.8 HR/9
2022 Blake Snell: 2.80 FIP, 12.0 K/9, 3.6 BB/9, 0.8 HR/9
Fielding independent pitching uses the three true outcomes to create an expected ERA for a pitcher.
That’s right. The underlying numbers suggest that, in many ways, 2022 Blake Snell was a better pitcher than 2018 Blake Snell. The 2018 Cy Young winning, ERA title-winning, All-Star Blake Snell.
[wpedon id=”49075″ align=”right”]
Now, 2022 Snell did have an exit velocity that was two miles per hour higher on average, a hard hit rate that was 4.5% higher, and allowed more line drives and fewer ground balls. However, the biggest reason for the disparity between the seasons (1.89 ERA in 2018 vs. 3.38 in 2022) is the fact that baseball is remarkably random. There are natural fluctuations between fortunes, and Snell has both benefited and suffered from them.
These numbers suggest that Snell produced a season in 2022 that rivaled his outstanding Cy Young year. If he can do that again, stay healthy, and get a little more luck than last year, a sub-3.00 ERA is far from the ceiling of what Snellzilla is capable of.
Sam is a Senior in High School. He has been writing for three years, and started at EVT in June of 2021. He’s headed to Syracuse’s Newhouse School of Communications in the fall of 2023.