Advanced Stat Friday: Franchy, Pirela, Hand & More
Mandatory Credit: Richard Mackson-USA TODAY Sports
With baseball executives taking new steps to understand the game, and baseball writers and analysts developing new methods to analyze play on the field, the baseball sabermetric revolution is in full swing.
Although the process really started with Bill James and his Baseball Abstracts in the 1980s, the baseball stat revolution didn’t start to take off until the Moneyball days of the Oakland Athletics, where on base percentage took the crown from batting average as the crown jewel of baseball stats.
Now 15 years later, all new stats abound, from wRC+ and wOBA, to FIP and SIERA, and all the way to the Statcast system which has brought us exit velocity, launch angle, catch probability, and on and on.
Given the state of advanced stats in the game today, there has never been a better time to find new ways to understand the game we all love.
With that spirit in mind, this will be a new series from East Village Times in which a plethora of stats will be discussed as they pertain to the San Diego Padres.
Each week we will list five to 10 interesting stats about the current Padres team or specific players.
Then we will focus in on one specific stat and do a deep dive in order to better understand how it works, how it is used, and what purpose it can serve in evaluating players both in the present and in the future.
Without further ado, happy Stat-ing.
- No player has been better in June than Jose Pirela who is slashing .441/.513/.735 in 39 June plate appearances with a .520 wOBA and 230 wRC+. Since coming up to the big leagues on June 6, Pirela has been seemingly unstoppable at the plate, although there is still some reason for skepticism. Despite the healthy slash line, it remains to be seen whether Pirela can maintain such a strong performance, especially with a high ground ball rate. However, Pirela has shown much-improved plate discipline from his previous big league stints, which could portend good things. Pirela may have made real adjustments that could improve his profile going forward. The biggest issue now will be finding a regular position for him to play.
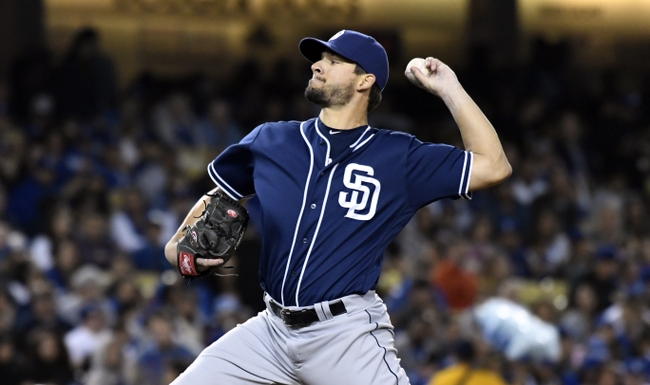
- After being utterly dominant over the first two months of the season, left-handed reliever Brad Hand gave up his first home run against his slider this season on Saturday against the Royals. Prior to his four run to home run blow up on Saturday, Hand had given up only seven earned runs since May 1, and only eight total earned runs the whole season. Hand has now thrown 255 sliders this season and given up hits on only six of them, including four singles, one double, and that one home run. By comparison, Hand has induced 56 whiffs on that pitch and is holding opposing hitters to a .094 batting average and .156 slugging percentage. It remains to be seen whether Hand is a Padre after the trade deadline, but that may be at least partially contingent on his slider effectiveness going forward.
- Among players with at least 50 innings pitched this season, right-hander Luis Perdomo has the third-highest ground ball rate in baseball at 65.4%. However, despite this success at getting ground balls, Perdomo is still seeing a .326 BABIP, which is much higher than most of his high-ground ball peers. To this point, Perdomo has been nothing if not frustrating. All the positive signs are there, strong ground ball rate, lots of weak contact, good pitch sequencing, but the results still just haven’t been there. Perdomo may be the most enigmatic player on the Padres to this point in the season.
- At least part of the reason that explains Perdomo’s high BABIP is that the Padres currently rank as one of the worst teams in infield defense because of their second lowest out rate at 69.4%. What this means is that the Padres are turning ground balls and bunts into outs only 69.4 percent of the time, meaning over 30 percent of ground balls aren’t being turned into outs. For players like Perdomo, who rely on these ground balls being turned into outs, it means some weird variance in performance. Perdomo has seen an almost full run difference between his ERA and FIP, and an even bigger gulf between his xFIP and ERA. If not for sometimes shaky defense and a high BABIP, Perdomo could be getting a lot better results on the mound. At least he got his first win of the year this week.
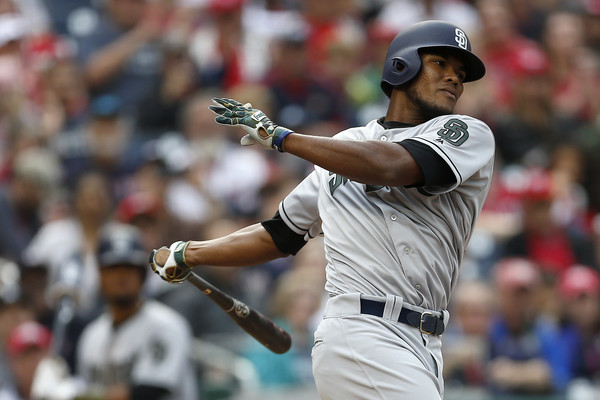
- Among players with at least 30 batted ball events, Franchy Cordero currently ranks 13th in baseball with a 92.4 average exit velocity. Among players with at least 50 plate appearances, Cordero has the second-lowest soft contact rate at just 5.9 percent. These numbers are obviously buoyed by small sample size, but both these numbers bode well for Cordero’s long term prospects, even with an upper-30 percent strikeout rate.
- Ryan Buchter has the second highest fly ball rate among qualified players at 52.5 percent. On top of that, Buchter has the 10th-lowest ground ball rate and the 11th-highest walk rate. Even with Buchter’s extreme batted ball and walk rates, the left-hander has still had some success this year, as his 3.38 ERA demonstrates, although his 4.58 FIP portends some regression in the future.
- Reliever Brandon Maurer has the third-highest difference between his ERA and FIP at 3.48. It’s been pretty clear all year that Maurer has been, at times, maddeningly inconsistent. However, his FIP numbers show that he has easily been the Padres’ best pitcher outside of Hand, even with the high ERA. Maurer has had some bad luck on balls in play, as demonstrated by his .351 BABIP, but his strikeout and walk rates have both improved from last year, while his HR/FB rate has also hung around the same place despite some early season struggles.
- The San Diego Padres are tied with the Texas Rangers for the highest IFFB rate in all of baseball at 12.9 percent. The Padres are also first in baseball as a team with a 21.9 percent soft contact rate. Hitting a lot of infield pop ups isn’t good. Making a lot of soft contact is even worse. With these two facts, it isn’t surprising that the Padres have one of the worst offenses in all of baseball.
- Among players with at least 100 batted ball events, Allen Cordoba has the fifth-lowest average exit velocity at just 79.8 mph. Erick Aybar is seventh at 81.4 mph. Through the first two months of the season, Cordoba was impressive, as the Rule-5 selection ran a 100+ wRC+ while playing decent defense in the outfield. However, things have taken a turn for the worse, as Cordoba stopped making solid contact and hasn’t been producing much at all on offense this month, as evidenced by his 37 wRC+ for the month of June.
- Among pitchers with at least 100 batted ball events against, Jered Weaver has the worst Barrel per PA rate at 9.4%. Jered Weaver, who has not pitched for almost a month now. Even though he has been gone for that long, Weaver is still the worst at something. It remains to be seen when Weaver will return, but it seems the Padres are ready to have Weaver return at some point this season. Once he does return, we can only expect him to pick up where he left off.
This week, let’s chat about Weighted Runs Created (wRC) and Weighted Runs Created Plus (wRC+) and how these stats are used as a more complete alternative to the standard triple slash line of batting average, on base percentage, and slugging percentage, and the more brute OPS and OPS+ calculations. At its basis, weighted runs created is a logical extension of Bill James’ Runs Created statistic. Rather than just look at different types of hits, and by extension runs and RBI, runs created attempted to quantify how many runs a player contributed to his team. wRC is actually very similar to wRAA, but instead of being scaled to zero, it is calculated using league average weights.
We don’t have to get too much into the nitty-gritty math here, but wRC is just a better approximation and more clear way of conveying both wRAA and woBA. wRC+ on the other hand, is the same calculation, but is controlled for both league and park effects. This way, in any given year you can compare players across different leagues and different parks. When using wRC+, league average is set at 100. So each number above 100 denotes one percent better than league average, while each value below denotes one percent worse than league average. By this calculation, a hitter with a 140 wRC+ is 40 percent better than the league average hitter.
Between the two, wRC+ is easier to use because it is a rate statistic rather than a counting stat like wRC, therefore it is easier to evaluate a player because the way you evaluate never changes. A 10 wRC in 50 plate appearances may be good, but a 10 wRC in 200 plate appearances is not at all good. By comparison, a 130 wRC+ is good whether it is over 50 plate appearances or 300. The only real pitfall of wRC+ is that it doesn’t control for position, so a 120 wRC+ catcher is not more valuable than a 120 wRC+ first baseman by this metric, even though the catcher is obviously much more valuable compared to his peers. In sum, weighted runs created plus is the most in-depth, yet simplistic way to measure total offensive performance.
Editorial and Prospect Writer for East Village Times. Twenty-five years young, Patrick has lived in San Diego for his entire life and has been a Padres fan nearly as long. Patrick lives for baseball and is always looking to learn new things about the game he loves through advanced stats.
Can you guys explain why no one uses RF/9? If getting to balls and creating outs are the keys to being a good defender, why is RF/9 not used more? I understand that it isn’t an end-all, and a lot of it has to do with pitchers (Infielders with a lot of sinkerball pitchers will have a higher RF/9), but it still seems like a useful stat to me.
Thank you!
It’s way too flawed. For similar reasons that errors and putouts are flawed. If the ball is never hit to you then you are considered a better defender just by virtue of having less opportunities to mess up.