A Deeper Look at wOBA, wRC+, and Much More


So overall, we are on the right track with wOBA, although there is another statistic, or I guess a pair of statistics, that have taken things a step forward for an even more accurate picture of offensive value: wRC and wRC+.
Based on the original runs created statistic created by Bill James, both wRC and wRC+ attempt to calculate how many runs a player contributes to his team with his overall offensive performance. I won’t get too much into James’ original calculation, but in its most basic form it used on-base percentage and slugging percentage multiplied by total at bats to get a measure of how many runs a player created. wRC does something similar, but uses the more accurate linear weights associated with wOBA in order to get a more accurate picture of offensive performance.
Before we move to wRC+, let’s first look at the simple calculation for weighted runs created.

Let’s break down the above formula into more easily digestible terms. You start by calculating wOBA, which we went over before, and then subtract the league average wOBA for any given season divided by the wOBA scale, which changes year to year based on the overall offensive environment of the league. For example, the wOBA scale for 2017 was just 1.185, which is down for the fourth consecutive year. This can be explained by the overall increase in runs being scored around the league, which makes the scale lower based on the higher threshold of offensive performance. Following that subtraction and division, you then add in the product of overall runs for the league divided by plate appearances multiplied by plate appearances of an individual player. This seems like a rather complicated calculation, but all the weights and scales are readily available on Fangraphs.com.
Where it does get a little more complicated is calculating wRC+, which is the same measure as wRC but adjusts for both park effects and the current run environment in order to get an accurate measure that can be compared across ballparks, leagues, and eras. Listed below is the formula for wRC+.
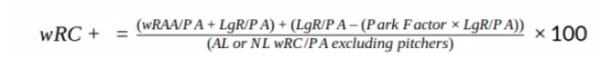
In order to lessen confusion, I am going to further illuminate this formula using the description provided by Fangraphs on their wRC/wRC+ page:
“The best way to explain how this works is to walk through each of the steps, starting from left to right. First we have wRAA/PA, which measures the number of runs above average a player contributes to his team at the plate per plate appearance. Another way to arrive at wRAA/PA is to simply take a player’s wOBA minus the League wOBA and divide it by the wOBA Scale. Both ways will return the exact same value, so it’s a matter of preference for how you want to do it. As always, the constants you need can be found here.
Next we have league average runs per plate appearance which is available on the Guts! page, just like all of the other constants. This is simply the MLB runs divided by the total number of plate appearances across the game during that season. We round this off at three digits in the table, so if your calculation is ever off by a small margin, this is likely why.
After that we have the park adjustment, which we arrive at using the additive method. Here we are essentially calculating how many runs per plate appearance we should add or subtract from a player’s total based on their home environment. To do so, we take MLB average R/PA and subtract out the MLB average R/PA times the park factor. To properly use the park factor, you should take the number listed on our park factor page and divide it by 100. So a 98 park factor should be used as 0.98 in this equation.
After we add all of those numbers together, you divide them by the specific league wRC/PA after removing pitchers from the calculation, which you will need to find using the leaderboards. Here are the numbers you need for the AL and NL for 2014. Simply change the year if you’re looking for older data. Then multiply everything by 100 just to make the presentation look better.”
In order to make this as straightforward as possible, the wRC+ calculation adjusts for league first, then park, then for overall offensive environment for any given season. This is done in order to be able to compare two players playing in different home ballparks, in different leagues or, and perhaps most importantly, players in different eras. Want to compare Mike Trout and Ted Williams? Using wRC+, you can do that.
Although wOBA was a giant step forward for baseball statistics, wRC+ is an even bigger leap forward because it allows an evaluator to compare a player across parks, leagues, and eras, which allows for a comprehensive evaluation of a player’s total offensive value. As for how to read these stats, using wRC is a bit more complicated because it is a counting stat, meaning a player with a wRC of 50 in 100 plate appearances is better than a player with a wRC of 50 in 300 plate appearances. On the other hand, wRC+ is more easily read and understood because each person’s wRC+ can be compared to a league average of 100 to get a quick measure on how good a player has been. Anything above 100 is considered above average while anything below is considered below average.
One thing wRC and wRC+ do not measure is the context of an individual hit, meaning no further weight is given to a hit with men on base over a hit with no men on base. However, there are statistics that do properly weight hits in different situations, but we will save those calculations for another day. In sum, wRC+ is the most accurate and easiest way to evaluate a player’s total offensive performance in any given season.
To sum this all up, weighted on base average and weighted runs created are the two most accurate offensive statistics for measuring player performance. There is clearly some mathematical calculation involved, but every statistical calculation in baseball has at least some math involved in it. My hopes are that this simplified these statistics, made them easier to understand for the average fan, and further illuminated why they are so useful for evaluating player performance. These new metrics are by no means perfect, but they can go much further in giving us an accurate picture of player performance than older school metrics. With that being said, there is still lots of value in more old-fashioned metrics. These new metrics don’t give us a catch-all, but they do provide a new source of information to make more thorough player evaluations.
Although this was meant to be a one-off sort of piece, there may be room for further discussion at a later point in the offseason.
Editorial and Prospect Writer for East Village Times. Twenty-five years young, Patrick has lived in San Diego for his entire life and has been a Padres fan nearly as long. Patrick lives for baseball and is always looking to learn new things about the game he loves through advanced stats.