A Deeper Look at wOBA, wRC+, and Much More


For the majority of baseball history, batting average was the crown jewel of baseball statistics. If a player wasn’t hitting at least .300, he wasn’t considered among the best players in baseball. Beyond that, players flirting with seasons closer to .400 were considered the best of the best in the game. It wasn’t until the Moneyball era under Billy Beane in Oakland that general managers really started consistently taking things a step further.
Now to be fair, Oakland started a more analytical approach in the early 1990s under Sandy Alderson, but it was taken to a whole new level by Beane in the late 90s and early 2000s. Sure, Bill James had been revolutionizing baseball statistics since the 1970s, but it took several decades before his research, or at least similar research, worked its way into the mainstream. Now, less than two decades from the beginning of Billy Beane’s Moneyball story, and the book and movie it spawned, we have reached a whole new level of advanced metrics.
Although Beane’s quest started out with just putting more emphasis on on-base percentage, something that had gone relatively overlooked throughout baseball history, advanced metrics have exploded in the game ever since. Obviously, people want to point to the fact that the Billy Beane-led Oakland Athletics never won anything during that time period, and still haven’t under Beane to the present day. However, regardless of the outcome, it is very clear that Beane did help spur a new, influential way of thinking about the game.
Since this time, the Baseball Prospectus’ and Fangraphs’ of the world have helped spur further innovation both within the inner circle of baseball general managers and outside of it. Over the last two decades, there has been the creation of a whole host of new statistics to measure all sorts of performance, whether it be offense, defense, pitching, or whatever else. Now, more than ever before, there truly is a statistic for almost everything within the game of baseball. Today I would like to focus on the flaws of batting average and the new statistics that have been created in its stead.
Before we break further into what wOBA and wRC/wRC+ are and why they are so useful, let us first dissect the flaws in using batting average to evaluate player performance. In its most basic form, batting average tells an evaluator how often a player gets a hit using total hits divided by the total number of at-bats. This represents a pretty good measure of just how often a player gets a hit but fails to measure other ways a player can get on base, such as walks and hit-by-pitches. This logically led to the creation of on-base percentage, which not only measures how often a player gets a hit but also how often they get on base via other means such as the aforementioned walks and hit-by-pitches. This is the focus Billy Beane had when building rosters in the early 2000s. Because more runs were correlated with more baserunners, Beane tried to roster as many players as possible with higher on-base percentages. It was clear it didn’t matter how a player got on base, as long as they did so at a frequent clip.
Beyond simply ignoring other means of getting on base, batting average also failed to rightfully value the differences between types of hits, a flaw which also lessens the value of on-base percentage. In order to remedy this situation, slugging percentage was created, which attempts to give higher weight to extra-base hits over single base hits by dividing the total number of bases by the total number of at-bats to arrive at a percentage. With on-base percentage and slugging percentage used in tandem, we were already well on our way to more efficiently evaluating player performance.
However, things were taken one step further with the creation of OPS and OPS+. OPS stands for on-base plus slugging and puts both on-base percentage and slugging percentage together in order to get a more clear picture of all the possible outcomes of an at bat. Therefore the higher the OPS, the better the player is at both getting on base and getting more valuable, extra-base hits, which are the two most valuable skills an offensive player can have. With OPS+, an evaluator can compare any single player to any other player in a different park, league, or overall offensive environment. By adjusting for the league in which a player played, it is easier to compare players from different leagues and different offensive environments.
While still revolutionary, neither on-base percentage nor slugging percentage, nor on-base plus slugging for that matter, were real game changers in the sabermetric revolution. Things took an even more important step forward in the late 2000s with the creation of wOBA (that’s weighted on-base average) by Tom Tango. The stated goal of wOBA is to measure a player’s offensive output by crediting a hitter for the value of each outcome (single, double, triple, home run) rather than simply evaluating all types of hits the same, as with batting average or on-base percentage. So in a way, wOBA is just a logical extension of slugging percentage and the OPS and OPS+ variations it spawned. However, wOBA is a bit more complex as a mathematical calculation.
The problem with slugging percentage is that it does weight different kinds of hits differently, but not accurately. I won’t get too much into the nitty-gritty math of it all, but Tango used good old-fashioned mathematical formulas to attempt to quantify the value of each offensive event and give each a linear weight. Using run expectancy tables, which I will link here, Tango measured out the value of each offensive event in order to use those weights to come up with a better measure of offensive performance than simple slugging percentage or even OPS. The weights of each event change year-to-year based on offensive environment, but the calculation on a yearly basis is still pretty much the same, as listed below. I will probably attempt to explain linear weights in further detail at a later date, but for now, they give us a better picture of how much each offensive event contributes to runs being scored.

So using this formula, you can arrive at a measure of how productive a player was on offense in any given season. All you do is take the total number of events of each category, multiply each by the weight given to that event, and divide by the total number of at-bats added to walks, HBPs, and sacrifices. For those curious, the linear weights for the 2017 season are as follows:
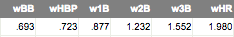
As you can see, a double isn’t quite twice as valuable as a single, and a triple is just over two times as valuable than a single. Using slugging percentage, extra base hits were valued in a more simplistic way, which limits the accuracy of the end result in the calculation. Using these linear weights originally calculated by Tango, you end up with a more accurate representation of a player’s offensive output in a particular offensive environment.
The most common question asked when discussing wOBA is this: Why use wOBA when statistics like on-base percentage or slugging percentage, or more importantly OPS, do a good enough job explaining offensive value? Well, the answer is a simple one. Sure, wOBA and OPS will lead you to similar conclusions about any given player, but the accuracy of the conclusions is limited using OPS. Using proper valuation of each offensive event, we can develop a more coherent picture of just how good a given player is on offense. wOBA is also simple to use, as it is scaled in the same way as on-base percentage, which makes it fairly easy to pick up and use to compare players. A wOBA of .320 is considered the league average, with a wOBA over .400 considered to be elite. The only real limitation to wOBA is that it is not park adjusted, meaning players playing in better offensive environments such as Coors Field will see a higher overall wOBA than they would otherwise.
For a better comparison of how much more useful wOBA is than OPS, look no further than this series of pie charts comparing the linear weights used in both statistics.
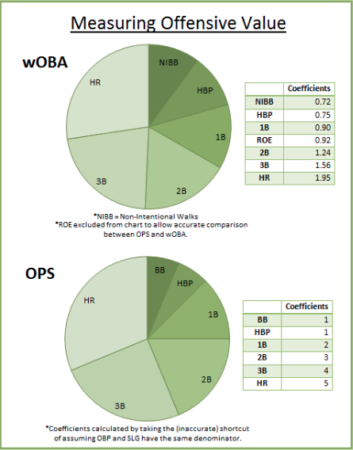
As you can see, the calculations for wOBA were arrived at mathematically using run expectancy tables, as discussed above, while the OPS calculation weights each event in a rather arbitrary way. Is a single really worth one more run than a walk? Is a double worth one more than a single? The answer is no, and a variety of calculations using run expectancy have borne those answers out.
For even more clarity, let’s look at some examples of players who may get wrongly dinged by batting average numbers. To name a few easy ones, both Aaron Judge and Giancarlo Stanton were sub-.300 hitters in 2007. However, both were among the five best players in baseball by wOBA. Considering batting average doesn’t account for their contributions in the walk department or their prodigious extra base power, both guys are wrongly docked value because of the type of offensive players they are. While Judge and Stanton are two easy examples, an even better example would be Texas Rangers infielder/outfielder Joey Gallo. Despite batting just .209(!) in 2017, Gallo still was one of the better offensive players in baseball with a .364 wOBA. Given a strong walk rate and lots of extra base power, Gallo is able to overcome his shortcomings, mainly not collecting lots of hits and striking out quite frequently. If we were evaluating just based on batting average, these players may not get the sort of attention they would otherwise deserve.
To really hit that point home, here’s a table filled with other players who may not look great by batting average or on-base percentage but look better with the help of wOBA. For clarity, this list includes the 21 qualified players in 2017 who had at least a 100 point gap between their batting average and weighted on base average.
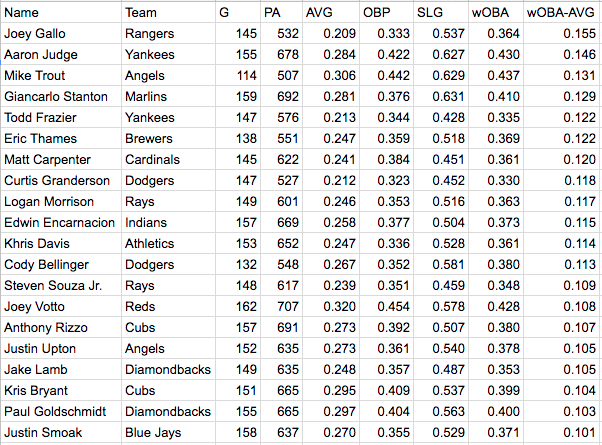
As you can see, there are quite a few guys in this table who would probably go overlooked based on batting average alone. Nine of the 21 had batting averages below .250, while all but two failed to reach the .300 threshold. Using wOBA, we can get a better picture of how effective some players are offensively, even without consistently high batting averages.
Editorial and Prospect Writer for East Village Times. Twenty-five years young, Patrick has lived in San Diego for his entire life and has been a Padres fan nearly as long. Patrick lives for baseball and is always looking to learn new things about the game he loves through advanced stats.